 Image 1 of 1
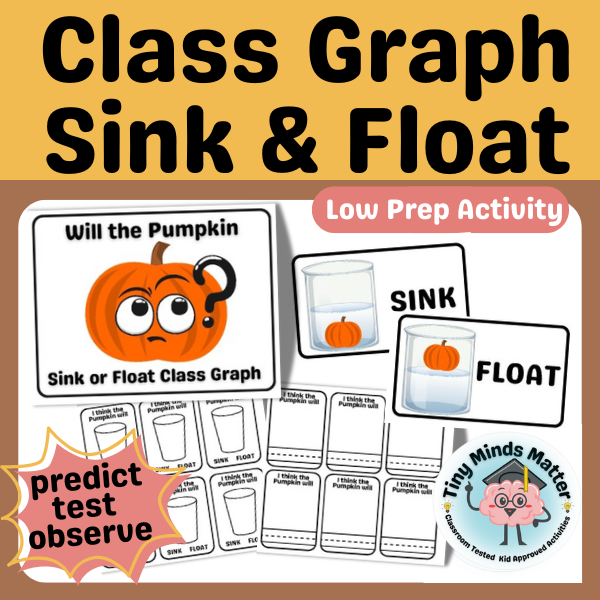
Make fall science hands-on, visual, and math-rich with this Pumpkin Sink or Float Class Graph! Students predict whether a real (or mini) pumpkin will sink or float, test it together, then record and analyze class results on a large graph. Perfect for circle time, science centers, or a quick whole-group investigation.
What’s Included
Class Graph Poster (portrait): “Pumpkin—Sink or Float?”
Prediction Cards: student “sink/float” choice cards (B&W)
Skills & Standards
Science/Inquiry: predicting, testing, observing, buoyancy basics
Math/Data: counting, comparing quantities, reading a simple graph
Language: using science vocabulary, speaking & listening during data talks
Easy Prep
Print the class graph and prediction cards (portrait, playful font).
Gather a pumpkin, clear bin of water, and towels.
Optional: laminate pieces for year-after-year use.
How to Use (Whole Group)
Wonder & Predict: Show the pumpkin. Ask, “Will it sink or float?”
Make Predictions: Students place their prediction card on the class graph.
Test It: Carefully place the pumpkin in water. Observe the result together.
Record & Discuss: Add the result to the graph, count, and use data talk prompts (Which had more? How many more? Did our predictions match?).